Charts, Graphs, and Maps
USLNG Export Statistics – Through Dec. 2023


2023: Dec. Nov. Oct. Sep. Aug. July June May Apr. Mar. Feb. Jan.
2022: Dec. Nov. Oct. Sept. Aug. July June May Apr. Mar. Feb. Jan.
2021: Dec. Nov. Oct. Sept. Aug. July June May Apr. Mar. Feb. Jan.
2020: Dec. Nov. Oct. Sept. Aug. July June May Apr. Mar. Feb. Jan.
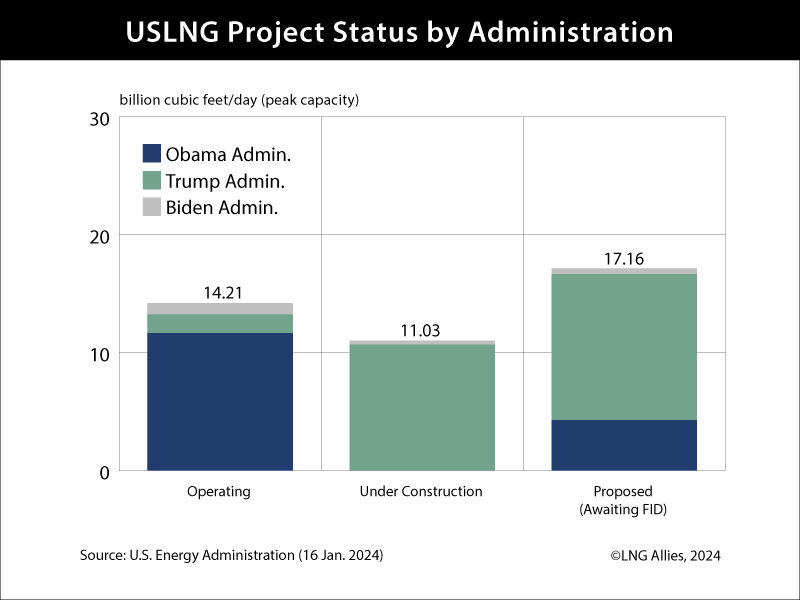
USLNG Export Projects (Updated as Developments Occur)


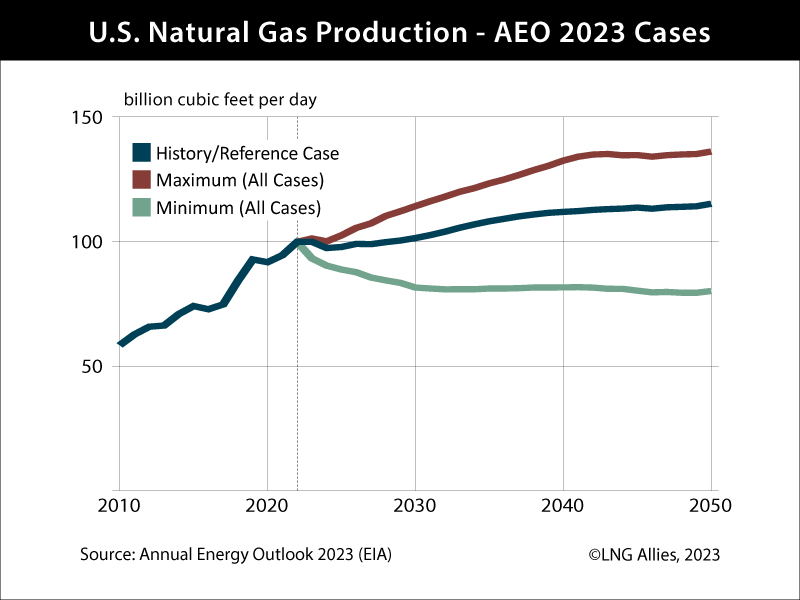
U.S. Natural Gas Resources, Reserves, Future Supply

Environmental Footprint of Natural Gas


U.S. Shale Gas Production (Updated Quarterly)

U.S. Natural Gas Production, Consumption, Prices (Updated Annually)